Home / Retail attention guide

A practical retail guide

How to turn passersby into people who stop, enter, and notice.

Foot traffic, dwell time, and product awareness are three different problems. Choose one behavior, establish a baseline, then change one thing you can measure.

Choose the behavior before the tactic.

A crowded shop, a quiet window, and an overlooked product need different fixes. Start with the moment that is underperforming.

More people enter

Count the people who pass and the people who enter during the same defined hours. Raw entries can rise because the area was busier. Entry rate tells you whether the shop converted more of the available traffic.Entry rate = entries ÷ passersby × 100

People stay with something longer

Define the zone that matters, such as a window, new-product table, fitting area, or service counter. Measure time in that zone and pair it with a useful action. A longer visit is not automatically a better visit.

A product becomes easier to notice

Choose one observable signal: product interactions, scans, questions to staff, product-page visits, inquiries, or featured-item sales. Keep the message focused on one product or collection so the result has a clear meaning.

Build a baseline you can trust.

Measure the same days, hours, and location before the change. A normal week is more useful than one unusually busy afternoon.

A simple shop-level scorecard
GoalCount beforeCount afterCompare
More entriesPassersby and entriesPassersby and entriesEntry rate, not entries alone
Useful dwellTime in one defined zone plus actionsThe same zone and actionsTypical time and action rate
Product awarenessOne chosen signalThe same chosen signalSignal per visitor or transaction

Record promotions, events, weather, access changes, and unusual traffic. Count anonymously where possible. Do not collect faces or personal information just to answer a shop-level question.

Compare entry rates before and after.

A busier day can produce more entries without making the entrance more effective. Compare the share of passersby who entered during like-for-like periods.

Baseline period
Test period

Your numbers stay in this browser. Nothing is submitted or saved.

Your comparison

Enter two comparable periods to see the difference in entry rate.

Baseline entry rate0%
Test entry rate0%
Percentage-point change0
Relative change0%

Plan a measurable wall test with Hudson Pictures.

Fix the message and sightline first.

Make the entrance easy to understand from the direction people approach. Remove competing messages. Give one product, collection, demonstration, or event the visual lead.

Show the benefit before the detail. Refresh the story before regular passersby stop noticing it. If the shop is already full, improve browsing and product discovery instead of chasing more entries.

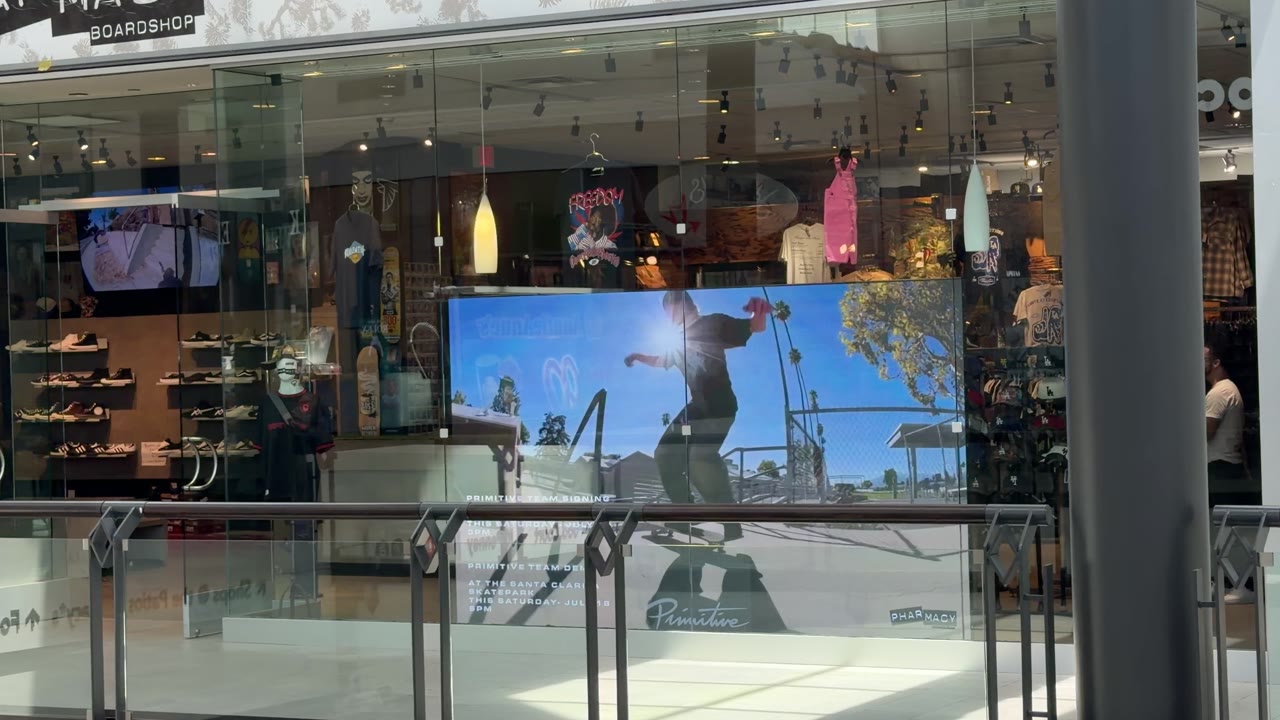
A ten and a half foot Hudson Pictures video wall filling the window at Pharmacy Boardshop

Use a moving wall when scale and change matter.

A large moving picture is useful when people can see it at the decision point and the content earns another look. Hardware cannot rescue a weak sightline or an unfocused message.

Good fit

A controlled indoor sightline visible from the approach, a launch or event that needs scale, a featured product that benefits from demonstration, or a space where the story changes often.

Poor fit

Direct sunlight, bright outdoor daylight, skylight glare, a bright entrance, an open-air placement, a blocked or distant sightline, or no person responsible for content.

Why freestanding matters

A freestanding wall can be placed for the behavior you want without opening the building. It can move when the shop changes, and the controller, cabling, and casters remain out of sight. Compare all five widths and prices.

What the research does support: a peer-reviewed field study covering 237 campaigns and 30 million shoppers in European food and household stores found that shoppers exposed to screens mounted over main aisles were 8.1% more likely to buy the advertised product. It did not measure foot traffic, dwell time, or whole-shop sales. Read the study.

Run one test you can explain.

  1. Name one primary outcome.More entries, useful dwell in one zone, or awareness of one product.
  2. Record the baseline.Use comparable days and hours. Keep the counting method unchanged.
  3. Change one visible thing.Use one message, one placement, and one featured product or collection.
  4. Compare like with like.Separate a better entry rate from a busier day. Note promotions, events, weather, and access changes.
  5. Keep, revise, or stop.If the chosen behavior did not improve, change the content or position before adding more messages.

Questions shop owners ask.

What is retail foot traffic?

Retail foot traffic is the number of people who enter during a defined period. To understand whether the entrance is working, compare entries with the number of people who passed during the same period.

How do you calculate a shop's entry rate?

Divide entries by passersby, then multiply by 100. Compare the rate across similar days and hours rather than comparing raw totals from different conditions.

What is customer dwell time?

It is the amount of time a person spends in the shop or in one defined area. Measure the area that matters and pair time with a useful action, such as a product interaction, inquiry, scan, or purchase.

How can a shop measure product awareness?

Choose one observable signal before the campaign starts, such as interactions with the featured product, QR scans, staff questions, product-page visits, or featured-item sales.

Can a video wall increase retail foot traffic?

It can give passersby a reason to look and enter when it is visible before they make that decision. Results depend on existing traffic, sightlines, placement, content, and the offer, so measure entries and passersby during comparable periods.

Start with one measurable goal.

Bring the space, the sightline, and the behavior you want to change. Hudson Pictures will help you choose a wall and a practical way to judge the result.